TIFF Webinar – Why Venture Capital Still Works (early-stage VC that is)

On April 2, 2025, TIFF hosted a webinar exploring insights from the white paper, “Why Venture Capital Still Works (early-stage VC that is),” led by Chris Anderson and Elizabeth Egan.

In this session Chris and Elizabeth highlighted the bear and bull case for why early-stage venture capital in today’s environment.  Topics covered:

    • Where’s the liquidity? (bear case)
    • Risk of an overhyped AI market (bear case)
    • Widening universe for innovation (bull case)
    • Early-stage as best access point (bull case)

Read the white paper here.

Watch the webinar recording, and more, here.

This webinar is for general informational purposes only and constitute neither an offer to sell nor a solicitation of an offer to buy securities. These materials also do not constitute an offer or advertisement of TIFF’s investment advisory services or investment, legal or tax advice. The asset classes discussed may not be suitable for all investors. Opinions expressed herein are those of TIFF and are not a recommendation to buy or sell any securities. Past performance does not guarantee future results. All investments are subject to risk, including the possible loss of principal.

These materials may contain forward-looking statements relating to future events. In some cases, you can identify forward-looking statements by terminology such as “may,” “will,” “should,” “expect,” “plan,” “intend,” “anticipate,” “believe,” “estimate,” “predict,” “potential,” or “continue,” the negative of such terms or other comparable terminology. Although TIFF believes the expectations reflected in the forward-looking statements are reasonable, future results cannot be guaranteed.

1st Quarter 2025 CIO Commentary

Executive Summary

  • Swift changes implemented by the Trump administration have led to increased market volatility and uncertainty.
  • Recent tariffs imposed by the US on Canada, Mexico, and China have created significant economic uncertainty and negatively affected markets as we approach the April 2nd reciprocal tariff announcements.
  • Economic indicators have weakened, with GDP growth expected to slow down and inflation predicted to rise, suggesting a challenging economic period may lie ahead.
  • The administration’s focus on deregulation, including a regulatory freeze and efforts to rescind existing regulations, is expected to lead to legal challenges and further market unpredictability.
  • Despite all this uncertainty we highlight the importance of maintaining a long-term investment focus amidst short-term volatility and avoiding hasty decision-making; stay focused on your investment goals.
  • With that in mind, we are maintaining our strategic asset allocation with 65% in the All Country World Index (ACWI), 20% in hedge funds, and 15% in the Bloomberg Aggregate Bond Index (AGG).

Fast and Furious

In previous letters, we’ve mentioned a quote attributed to Vladimir Lenin:

“Sometimes nothing happens for decades, and sometimes decades happen in a week.”

We were referring to the rapid impact of AI on our world. Since Donald Trump’s re-election and return to the White House, events seem to be accelerating faster than ever.

Every new president promises change, but none has delivered as swiftly as Trump has in his second term. It is worth noting that he signed 26 executive orders on his first day back in office and has reached 92 as of March 20, 2025, in addition to the 220 he signed during his first term. For comparison, Biden signed 160 executive orders in four years, Obama 276 in eight years, and Franklin Roosevelt holds the record with 3,721 over 12 years. Keeping up with these changes has been challenging and exhausting for most.

There is significant debate among intelligent and honest people about the effectiveness and potential outcomes of most of Trump’s ideas. As new ideas emerge and are debated, they naturally create more questions and uncertainty. We anticipated significant change under Trump, but the pace of change has been dizzying even for us.

Let the Chaos Begin

On March 4, 2025, Trump’s first tariffs on Canada and Mexico took effect, along with an additional 10% tariff on China. The reasons given for these tariffs were sometimes economic and sometimes to punish a country for allowing fentanyl and other harmful agents to come into our country. Canada and China retaliated, and Mexico was expected to announce retaliatory tariffs. Markets are reacting negatively. Many were surprised that Trump went through with the tariffs on Canada and Mexico, who seemed to be calling his bluff. Similarly, the February 28 Zelensky conflict at the White House cast doubt on the Ukraine/Russia peace process, as Trump temporarily halted US aid to Ukraine and upset our European allies. A few weeks later, most of these tariffs have been changed (and will be again on April 2), and Zelensky and Trump seem to be back on the same team, depending on the day. The apparent chaos of recent weeks is causing concern both domestically and globally and has increased market volatility. This is likely to continue as tariffs increase and negotiations everywhere on everything continue.

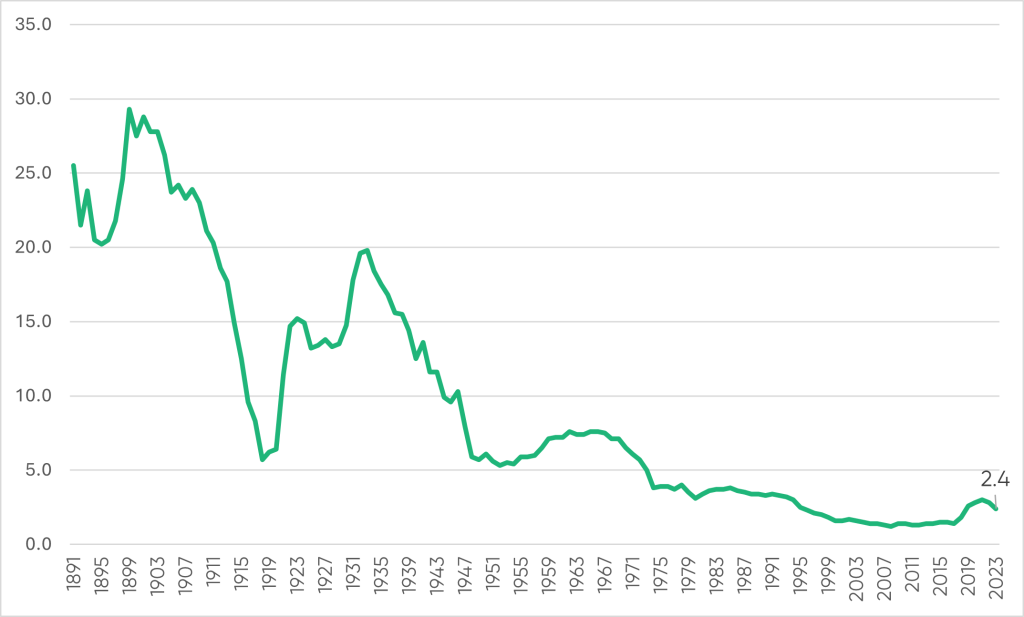
While Tariffs are Still Below Historical Levels, They are Reaching the Highest Levels Seen in Nearly 30 years

US Duties Collected as a % of Total Imports1

US Duties Collected as a % of Total Imports

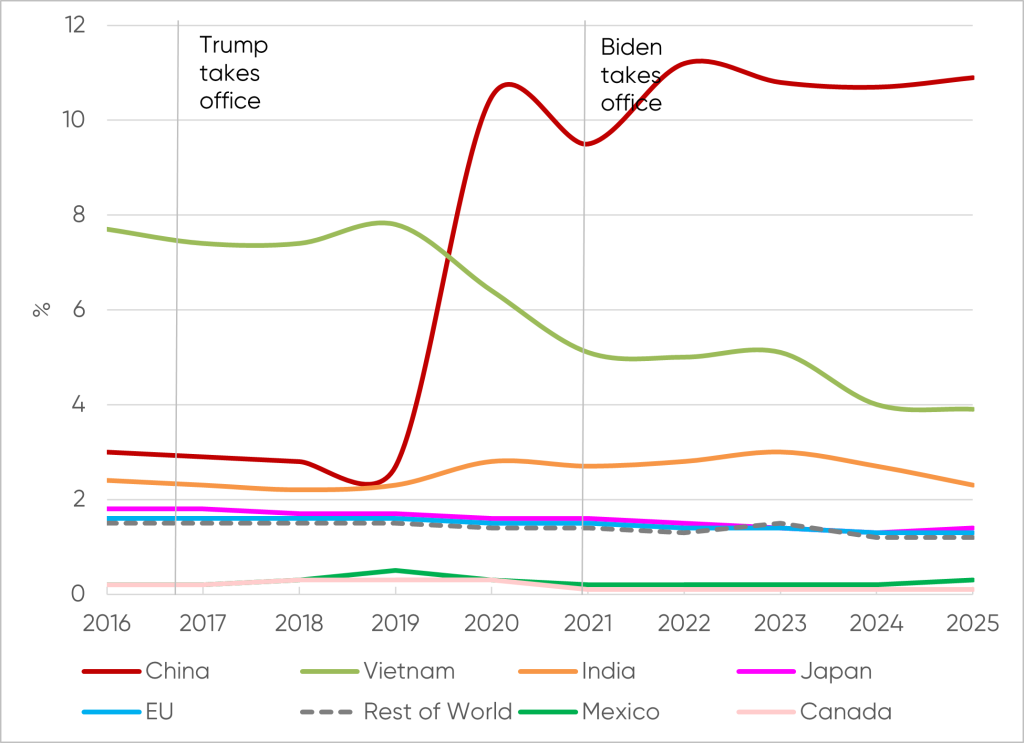
With the Exception of China, the US Tariffs on the Rest of the World are Still Rather Low, Meaning If the Trump Administration is Serious About Increasing Tariffs, We May Have a Long Way to Go

US Effective Tariff Rate by Import Source Country, 12-month Rolling Average2

US Effective Tariff Rate by Import Source Country, 12-month Rolling Average

The most important tariff day looks to be April 2, when the US government plans to announce reciprocal tariffs. As we understand this undertaking, whatever tariff (including, in some cases, V.A.T) a country charges us is the tariff we will levy back on them. Ironically, this could either result in tariff wars or in a free trade relationship, depending on what tariff a foreign country chooses to charge us. The cone of possible outcomes around this is wide, increasing uncertainty. Several economic indicators have recently weakened, compounding the impact of this uncertainty and suggesting a challenging period may lie ahead for the economy and markets. The Federal Open Market Committee recently revised expected 2025 GDP growth down by 0.4% to 1.7% and inflation (core PCE) up by 0.3% to 2.8%. They expect tariff inflation to be “transitory” and left rates unchanged, noting that uncertainty has increased.

The new administration also is focused on removing regulations. In addition to implementing a regulatory freeze pending review and halting all new regulations, they aim to keep the total incremental cost of all new regulations in fiscal year 2025 to “significantly less than zero.” Agencies are directed to identify and rescind regulations inconsistent with Trump administration policies, and for every new regulation proposed, 10 must be identified for repeal. This leads to many de-regulation efforts being challenged in court, slowing their impact and likely sending some to the Supreme Court. It is a busy, unique, and chaotic time in Washington. The desired changes could lead to significantly better or worse outcomes, keeping markets on edge.

The Department of Government Efficiency (DOGE), which we hope can reduce the US government’s annual deficit by eliminating waste, fraud, and abuse within the Federal government, is off to a mixed start. While the website “polymarket.com/doge” suggests they have already identified $115 billion in annual savings, the media focus has been more on Elon Musk and the number of jobs potentially impacted. A respected research service recently increased their estimate of government worker layoffs before July 4, 2026, to more than 10% of current employees. This adds to current economic concerns and raises questions about the follow-on impacts, further exacerbating market uncertainty.

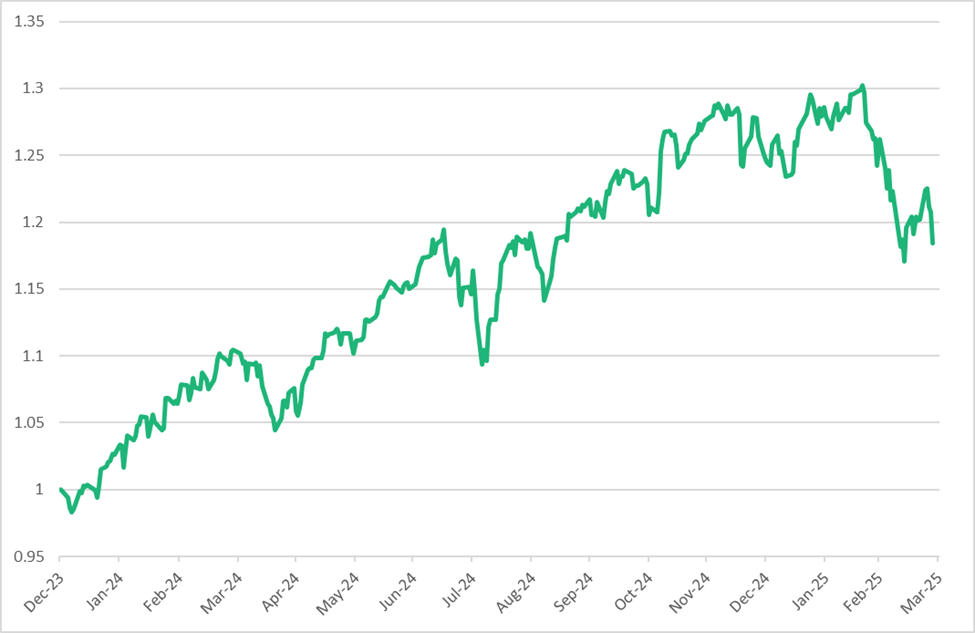
US stocks have accordingly fallen, dropping over 9% from peak year-to-date gains of nearly 5% to now sit near -4% for the year. Meanwhile, ten-year treasury bonds have rallied in price by about 3%, pushing the yield from 4.6% in January down to 4.2%, near the lowest since last September. This performance combination usually suggests a weakening economy and slowing earnings, ultimately pulling inflation down. Interestingly, while President Trump and his team believe targeted countries will pay the tariffs, most economists view tariffs as a tax that US businesses and consumers will pay through higher prices. Stocks could decline in either case, but if inflation rises rather than falls, the current decline in bond yields may be temporary.

S&P 500 Pulled Back to Pre-Election Level Following Strong Market Growth

S&P 500 Net Total Return (12/31/2023 – 03/31/2025)3

S&P 500 Net Total Return 12312023 - 03312025

A Word of Caution

Before we get into what we are doing about this elevated uncertainty, let us tell you what we aren’t doing: we aren’t getting swept up in the short-term day-to-day uncertainty. When investors start making major decisions based on short-term changes in macro numbers, we think that is risky. We’ve recently read that the most important decisions one needs to make today include whether the US is going to become partners with Russia, how the Middle East will end up, how much tariffs will increase inflation, how badly the DOGE layoffs will impact the economy, whether US exceptionalism is dead and US equities should be underweighted, etc. We don’t profess to know the answers to these questions. Yes, we have hunches and opinions like everyone else, but we also have enough experience to know that we don’t know nearly enough to correctly predict any of these outcomes let alone the preponderance of them.

Making too many decisions is usually harmful to long-term returns. I’ll briefly share my first lesson on this. On Black Monday, October 19, 1987, the Dow Jones fell by 22.6%, the largest one-day percentage return on record. Many people believed this signaled that the US was entering a depression ala 1929, the previous largest one-day percentage decline (-13.5%). As a 20-something-year-old, how could I disagree? I read all the “analysis” of the day, which was very lopsided, suggesting it was a fait accompli. My then CIO, Dick Huson, admitted that he didn’t know but strongly encouraged us to appreciate that nobody else did either, and so we should stay the course. He noted that the drop was many standard deviations above average, and it was a poor time to sell (it turned out to be a 28 standard deviation event, equivalent to a man who is 300 miles tall!). One month later, the S&P 500 returned 7%, and three months after that, it appreciated 18%. There was no depression; instead, we had elevated volatility and attractive returns.

Another event worth mentioning is the Global Financial Crisis of 2008, the biggest peak-to-trough loss since the great depression. The S&P peaked on October 11, 2007, before the US housing bubble-inspired credit crunch brought the financial world to its knees. As the world watched, the Fed let Lehman Brothers collapse, and financial contagion threatened further collapses. Markets fell precipitously before cooler heads finally prevailed, but not before the market had fallen nearly 57% by March 9, 2009.  Four years later, the S&P had gained 150% (nearly 26% per annum) to recover to its previous high. Ten-year returns from the pre-crash high in 2007 were 104%, equal to 7.4% per annum.

Timing the exact moment to get out of and then back into the markets is very difficult. This is why we partner with some of the very best managers in the world and why we try to limit the number and size of decisions we make. The stock market can be volatile and can go down. Nevertheless, we have not found a liquid asset that can provide better, reasonably consistent, above-average long-term returns to hold in our portfolios. This is why we are careful not to get underweight equities and will only modestly overweight them if we believe a significant opportunity exists. When asked, we counsel others to do the same if they are trying to generate above-average long-term results.

Enough, what are we doing?

For now, we assume mainstream economists are correct in believing tariffs will negatively affect the US economy. Estimates are changing quickly, but aggregating estimates from different sources suggests that the US GDP is expected to slow down by 0.5% – 1% due to the expected newly implemented tariffs. This could lead to job losses of up to 200,000 on top of those laid off by DOGE, and consumer prices could rise by 1%. Combined with immigrant deportations and strict border control, this should reduce aggregate consumer spending. On the flip side, the current tariffs could raise $1.5 trillion over the next 10 years. A 10% universal tariff could raise $2 trillion, and a 20% universal tariff could raise $3.3 trillion over that period. However, these estimates do not account for potential retaliatory actions by other countries or the duration of the tariffs. Our economic future is murkier than it seemed three months ago.

Are we trimming our equity holdings, you ask? Not yet. Looking forward, we see continued productivity gains in the US and globally from the adoption and incorporation of AI within businesses. Some early adopters are experiencing radical productivity improvements, as noted in ARK Investments’ “Big Ideas 2025” report. They highlight how AI software engineering contributions have risen from 4% to 72% of work. In new drug development, the number of new hypotheses a research scientist could test in one year rose from 20 hypotheses tested in 2023 to 200 tested in 2024. ARK expects technological breakthroughs like these, and others in AI, Autonomous Mobility, and Humanoid Robots, to turbocharge economic growth over the next 5 to 10 years, potentially to as much as 7+% per annum. While this view is uncommonly bullish, AI is a very unique technology, and early adoption will accelerate productivity gains, living standards, and possibly markets.

One other area we are exploring is Europe. While the US is experiencing tremendous change, Europe is in the throes of generational change. We believe Europe’s newfound focus on self-reliance, more rational energy and fiscal policies, reduced austerity, less regulation, and more defense spending (much of these changes have been foisted upon them by a now undependable US) may allow Europe to emerge from what many perceive to be a self-induced 15- to 20- year malaise. The internal debate continues about whether Europe presents opportunities for additional investment in our portfolios.

Wrapping it Up

We have strayed further than intended in this letter. Our main point is that things are moving very fast. Volatility is likely to remain elevated for a time and will cause some investors to lose focus on their long-term goals and instead make unnecessary decisions that will likely need to be reversed. We try to avoid making too many decisions with poor information during these times and instead continue to look forward and stay focused on what the future world might look like. Skating to where the puck will be is always our goal.

Rather than make decisions under uncertainty, we believe now is a good time to look over the potential valley and ask ourselves how AI might impact the world in the next 3-5 years and what could that mean. We don’t know if markets will pull back as they did after the internet bubble or if the advancements this time are so significant that technology’s full valuation has not yet been realized. Combining an expected more volatile short-term period with a brighter long-term view, we will navigate this period by owning more hedges designed to capture market unease while partnering with the best managers globally and remaining invested for the long term. If the economy weakens and inflation decreases, bonds may perform better. Bonds could perform better still if the DOGE succeeds in cutting the budget deficit.

Equities are expected to experience increased volatility this year as the political environment seeks a new equilibrium and tariff uncertainties get answered. While tariffs may slow economic growth and boost inflation—potentially triggering stagflation fears—the expected productivity gains and growth benefits from AI adoption should help temper any excessive market pessimism.  This period should be temporary. Subsequently, we can imagine a scenario where conflict fatigue leads to a calmer global environment. In this scenario, the potential success of the DOGE combined with lower taxes, less regulation, and more efficiency may allow the US to ease its tariff program, creating a more favorable cycle for both global GDP and equity markets. As we move forward, we will continue to share our thoughts and insights with you. For now, we are staying close to our strategic asset allocation targets: 65% in the All Country World Index (ACWI), 20% in hedge funds, and 15% in the Bloomberg Aggregate Bond Index (AGG).

As always, we greatly appreciate the opportunity to manage your capital and help you achieve your organization’s goals. We are here to assist in any way possible, so please feel free to reach out to us with any questions or needs.

Your TIFF Investment Team

Past performance is no guarantee of future results and the opinions presented cannot be viewed as an indicator of future performance. There is no guarantee that any particular asset allocation or mix of strategies will meet your investment objectives.

These materials are being provided for informational purposes only and constitute neither an offer to sell nor a solicitation of an offer to buy securities. These materials also do not constitute an offer or advertisement of TIFF’s investment advisory services or investment, legal or tax advice. Opinions expressed herein are those of TIFF and are not a recommendation to buy or sell any securities.

These materials may contain forward-looking statements relating to future events. In some cases, you can identify forward-looking statements by terminology such as “may,” “will,” “should,” “expect,” “plan,” “intend,” “anticipate,” “believe,” “estimate,” “predict,” “potential,” or “continue,” the negative of such terms or other comparable terminology. Although TIFF believes the expectations reflected in the forward-looking statements are reasonable, future results cannot be guaranteed.

Footnotes

  1. United States International Trade Commission. https://www.usitc.gov/documents/dataweb/ave_table_1891_2023.pdf.

  2. Hannah Miao, “Breaking Down Trump’s Tariffs on China and the World, In Charts,” Wall Street Journal, December 3, 2024, https://www.wsj.com/economy/trade/trump-tariff-rates-china-world-trade-charts-3d6aee09.

  3. Source: Bloomberg.

How Endowments and Foundations Can Manage Inflation Risk

Executive Summary

  • Hedging inflation in endowment and foundation portfolios is challenging because many hedging instruments have proven largely ineffective for two reasons:
    1. Low reliability: they do not reliably respond to inflation in the way theory suggests.
    2. High opportunity cost: they supplant productive core portfolio allocations and underperform when inflation is benign.
  • Many “classic” hedging allocations such as real estate, real assets, and gold fall in this camp, suffering from unreliability and/or high net cost.
  • Other strategies, including portfolio duration management and inflation swap overlays, have shown efficacy with carefully managed implementation.

The Challenge of Hedging Inflation

Of all the risks faced by endowment and foundation (E&F) investors, inflation is among the most challenging to hedge. Over time an actively managed portfolio consistently focused on equities, taking prudent advantage of private investments and appropriately diversified, has the best chance of delivering a robust real return over inflation. However, as we’ve been reminded over the last few years, spikes in inflation can make this goal harder to achieve. An inflation hedging allocation seeks to mitigate these periodic challenges.

The theory is straightforward – two types of assets should work as hedges:

  1. Those with intrinsic value that will make their prices grow with inflation. For most portfolios, the investable version of such assets is commodities, including gold, and some commodity-like real assets such as timber.
  2. Those with the ability to increase their cash yields in line with inflation. These assets include rent-generating real estate, infrastructure real assets such as toll roads or utilities, and inflation-indexed securities such as the US Treasury’s TIPS.

Of course, the reality is anything but straightforward for two basic reasons. First, the economy hardly sits by passively when inflation emerges (or recedes) – consumers, producers, and government all react, impacting demand, supply, interest rates, and fiscal policy in ways that can overwhelm the theoretical responses of inflation hedges, making them less reliable. Second, inflation hedges have meaningful opportunity cost as they generally underperform when inflation is benign and also supplant part of the core elements of an investment portfolio, costs which can outweigh their benefits.

Which Classic Strategies Have Worked?

So, if inflation hedges are unreliable and costly, how does one decide which (if any) to employ? One approach is to assess reliability and opportunity cost practically by modeling an investable hedging strategy and observing whether it would have added value to the type of portfolio E&Fs actually employ. Let us first look at the impact of the classic hedging strategies mentioned above: commodities, including gold; real estate and real assets; and TIPS. We focus on practical liquid implementations that i) are accessible to typical E&Fs and ii) can be added to or removed from a portfolio as inflation risks warrant.

We look at rolling 1-year periods, both inflationary and non-inflationary, during the past 40 years*. We choose 1-year periods because the response of hedges to inflation1 can take time, and shorter periods, such as a quarter-year, may not show a relationship, while longer multi-year periods often incorporate both an increase and subsequent decrease in inflation, again muddying the relationship. For each asset, first, we check reliability by observing the correlation of returns with inflation – is there evidence that the asset responds to inflation as hoped?

If there is a meaningful correlation, we will then check the cost/benefit: the excess return generated by the hedged portfolio vs the unhedged portfolio. To assess this cost/benefit correctly, the core portfolio must be representative – what core investment do we forgo and replace with a hedge? E&Fs are endlessly diverse in many dimensions, but at a high level share a fundamental investment goal: funding their missions reliably and effectively over the very long term. Parsing this goal leads to common requirements for their portfolios:

  • Funding requires ready liquidity for distributions, while their long-term horizon often permits prudent but meaningful high-potential illiquid private investment.
  • Continued effectiveness requires, at a minimum, growth with inflation net of distributions, while reliability requires volatility management via diversification.

To achieve these requirements, a typical TIFF client portfolio might have an illiquid budget of 10-35%, with the balance in liquid assets, and about 2/3rds of assets in growth-driving equities with the balance in volatility-reducing diversifying investments. For this exercise, we assume a core portfolio of 45% liquid equity2, 20% private equity3, and 35% fixed income4.

Commodities and gold

A broad basket of commodities5 has a correlation of about 0.64 over this period, indicating that statistically about 40% of its return is explained by inflation and that it has some promise as an inflation hedge. In contrast, gold6, perhaps the most “classic” inflation hedging instrument, has a correlation of approximately zero. While there is little doubt that gold has some inherent inflation hedging power, this inflation response has generally been overwhelmed by all the other market forces driving its value. We do not rule out gold as a hedge but cannot call it reliable.

Having established that commodities have some reliability, we test adding commodities to the portfolio. Commodities are volatile but have very little correlation with equities, so they replace part of the core portfolio’s non-equity diversifying allocation, 10% of it for our test.

Commodities Hedged Portfolio Annual Excess Return vs Annual CPI

Commodities Hedged Portfolio Annual Excess Return vs Annual CPI

We observe the high volatility and limited reliability of the hedge, particularly in years when inflation is not extreme: while about 40% of commodity return is explained by inflation, 60% is due to market forces unrelated to inflation. However, in the most inflationary (and deflationary) years the relationship between commodities and inflation is more apparent. Across all observed periods, the commodity hedge generates approximately 0.75% additional return for each 1% rise in inflation—a significant contribution when endowments and foundations typically target a 5% real return. Commodities do not make sense to us as a permanent hedging allocation, but they can be valuable if selectively employed when inflation risks are emerging.

Real estate and real assets

Both liquid real estate7 and liquid real assets8 have correlations with inflation of about 0.1, indicating that inflation explains almost none of their returns. Some of their unreliability stems from factors noted above, such as the fact that in a dynamic economy, they may be unable to increase rents and other cash flows in line with inflation to the extent theory suggests. But the bigger factor degrading their hedging power is interest rate sensitivity. Real estate and real assets are inherently illiquid, but they are made liquid and readily investable via securitization in real estate investment trusts (REITs) and similar real asset structures. These structures are companies that borrow (typically 50% of assets or more) to grow and achieve equity-like returns and are negatively impacted by the rising rates that generally accompany inflation.

TIPS

A broad TIPS index9 has a correlation of approximately zero. This observation seems counterintuitive for an instrument indexed to inflation, but again, the reason is interest rate sensitivity. TIPS are bonds with duration, and on average their inflation indexing benefit is offset by their sensitivity to rising rates during emerging inflation.

What Other Strategies Can Help?

Short Duration

Since rising rates often accompany inflation, one approach could be simply to reduce the interest rate sensitivity (duration) of the portfolio. We model this strategy by exchanging longer-duration diversifying assets for cash-like very short-duration treasuries10:

Duration Hedged Portfolio Annual Excess Return vs Annual CPI

Duration Hedged Portfolio Annual Excess Return vs Annual CPI

Similar to the commodity hedge, there is much volatility in most years as the return of interest rate exposure is, in general, not highly correlated with inflation; however, the relationship is again clearer in more extreme inflation regimes. Reducing portfolio duration when inflation-driven interest rate increases are anticipated clearly makes sense, but it’s equally important to increase duration again ahead of interest rate reductions. The cost/benefit is moderate on average, as even if replacing the full 35% longer-duration allocation with cash (illustrated in the plot above), the portfolio’s return increases by 0.5% for every 1% increase in inflation. Similar to commodities, shortening portfolio duration makes sense as an inflation hedge when applied selectively when risks are disproportionately towards higher inflation and rates.

Illiquid Real Estate / Real Assets

Another possibility is to replace some of the core portfolio’s private equity allocation with private real estate or real assets. In illiquid form, these assets can be held directly without leverage and, therefore, with much less interest rate sensitivity. While private asset data is too sparse for the statistical analysis we have done here for liquid assets, we do believe that directly held real estate and assets demonstrate reliability against inflation.  However, we also believe that for the typical endowment portfolio their opportunity cost is too great. The upside potential of private equity is too high to forgo for inflation hedging when there is a limited illiquid asset budget available. And unlike liquid hedges, an effective private asset hedge cannot be employed periodically but instead must be committed to and left in place through complete inflation cycles.  Private asset hedges can make sense for the largest endowments with very substantial illiquid allocations, particularly those with ancillary needs for real estate investment (such as universities and hospitals) and the very large scale necessary to consistently outperform in these sectors.

Inflation Swaps

An inflation swap is a derivative contract in which the payer pays an agreed-upon fixed rate at the outset of the swap while the receiver pays a rate equal to the inflation that is actually experienced during the swap’s duration. The fixed-payer rate is thus effectively the prevailing breakeven inflation rate for the period. If realized inflation proves higher than this breakeven, the payer receives the difference, while if it comes in lower, the payer pays the difference. This instrument is purpose-built for inflation hedging and has several advantages.  First, it is liquid and can be put on and taken off on a daily basis.  Second, it has no direct interest-rate exposure, not only to rate duration but also to short-term rates. Third, while this market breakeven rate changes continuously, it is not very volatile (~2% annual volatility over the past ~25 years that this swap has been implementable**) compared to the core portfolio or the other hedges described above, which all have annual volatilities in the teens. This low volatility means an inflation swap can be added to the portfolio in large notional size without increasing overall portfolio risk. For illustration, consider 1-year swaps11, which pay out based on realized inflation over 12 months:

Inflation Swap Hedged Portfolio Annual Excess Return vs Annual CPI

Inflation Swap Hedged Portfolio Annual Excess Return vs Annual CPI

We observe very high correlation (~0.9) with inflation as hoped. At a size consistent with the swap’s very low volatility (~75% of portfolio NAV), the portfolio, on average, gains a respectable ~0.65% for every 1% increase in in inflation. However, the swap is not a panacea because, as expected of any liquid market hedge, it is, over time, fairly valued: when inflation risks are high, the price of insurance goes up. During this period, these swaps post a gain in ~55% of rolling years and a loss in the other ~45%. Over very long periods, we expect a 50-50 track record. We believe inflation swaps can be very effective but, like other hedging tools, must be employed selectively when risks are elevated.

Conclusion

TIFF’s approach to managing against inflation reflects these real-world observations. TIFF has largely eschewed gold as well as liquid real estate and real assets, and while we do not rule out private real estate and real assets as attractive investments per se, we have not deployed illiquid capacity to them for the purpose of inflation hedging, keeping the illiquid allocation focused on private equity. We will periodically employ the strategies supported by our observations:

  • We may add passive broad commodity baskets, as well as maintain long-term investments in active equity managers who themselves will take on commodity exposure (e.g. in the metals and mining industry)
  • We may shorten the portfolio’s duration
  • We may employ inflation swaps, either directly or in the form of short-term TIPS, which are effectively an inflation swap combined with a duration-reducing short-term treasury note

A common theme is that these hedges are not effective as “set and forget” permanent allocations; rather they must be managed and deployed periodically with an eye towards current inflation risks. TIFF implements these strategies for its clients selectively when warranted based on real time pricing and data around inflation expectations.

We find inflation hedging as challenging as does the rest of the investment world. Ultimately, we believe the best defense is a good offense: to maintain focus on generating long-term excess real return via an actively managed, equity-oriented portfolio with a prudent private investment allocation.  We believe that running up the score with this approach, combined with some modest, carefully employed hedging, gives our clients the best long-term protection against inflation.

The materials are being provided for informational purposes only and constitute neither an offer to sell nor a solicitation of an offer to buy securities. These materials also do not constitute an offer or advertisement of TIFF’s investment advisory services or investment, legal or tax advice. Opinions expressed herein are those of TIFF and are not a recommendation to buy or sell any securities.

These materials may contain forward-looking statements relating to future events. In some cases, you can identify forward-looking statements by terminology such as “may,” “will,” “should,” “expect,” “plan,” “intend,” “anticipate,” “believe,” “estimate,” “predict,” “potential,” or “continue,” the negative of such terms or other comparable terminology. Although TIFF believes the expectations reflected in the forward-looking statements are reasonable, future results cannot be guaranteed.

* Why 40 years? Beyond that time, the forms of inflation hedges that typical E&F investors can practically access were much less available, and data for them is sparse. For instance, TIPS were only introduced in 1997. More importantly, we believe the response of the economy and policy makers to inflation is meaningfully different since the devastating inflation of the 1970s and the massive response of the Volcker Fed wound down in the early 1980s.

** The inflation swap is equivalent to a position owning a TIPS and selling short a nominal treasury of exactly equal duration. The swap exists as a liquid instrument because of the introduction of TIPS in 1997.

Footnotes

  1. US CPI Urban Consumers SA YoY as of December 31, 2024. Bloomberg.

  2. S&P 500 Total Return Index as of December 31, 2024. Bloomberg.

  3. Bloomberg Buyout Private Equity Index and Bloomberg Venture Capital Index as of December 31, 2024. Bloomberg.

  4. Bloomberg US Aggregate Total Return Value Unhedged USD as of December 31, 2024. Bloomberg.

  5. Bloomberg Commodity Index Total Return as of December 31, 2024. Bloomberg.

  6. Bloomberg Gold Subindex Total Return as of December 31, 2024. Bloomberg.

  7. Dow Jones Equity REIT Total Return Index as of December 31, 2024. Bloomberg.

  8. MSCI World Infrastructure Net Total Return USD Index as of December 31, 2024. Bloomberg.

  9. Bloomberg US Treasury Inflation-Linked Bond Index as of December 31, 2024. Bloomberg.

  10. Bloomberg Short Treasury: 1-3 Months Total Return Index Unhedged as of December 31, 2024. Bloomberg.

  11. USD Inflation Swap Zero Coupon 1 Year as of December 31, 2024. Bloomberg.